
The Bottom End
Step by Step
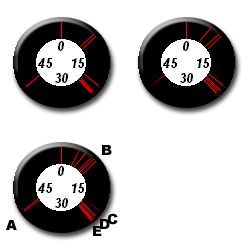
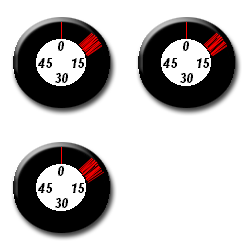
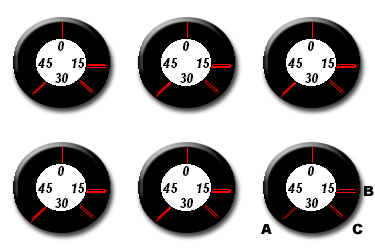
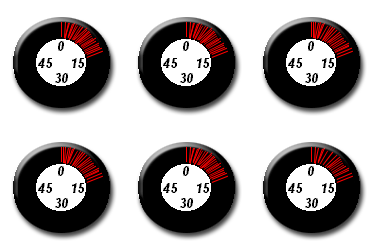
The graph and flasher examples below are the four, number one readings you will encounter. While no two screens will ever be the same, you can bet they will have something in common with the ones shown below.. The only difference between a flasher and a LCR, is that the LCR is a computer that can read a flasher. As with any computer, the LCR has memory. Enough memory to record what it saw for the length of the screen.
1) The first example shows bait fish on top and larger fish on bottom. The parts to notice here are the evidence of a hard bottom (A). The thin black line on the LCR and the double reading on the flasher. The bait fish show up as (B) larger fish, as (C) cover, as (D) the actual depth, as (E). Notice that (D) on the flasher is the strongest reading. It is hard to define between cover on bottom and fish. However, there is a much weaker signal from the fish than there is from the cover. Plus, the fish should show up more since there is probably more fish than cover.2) In this example, we learn that flashers lose a lot of important detail; such as fish and cover (A). Also the flasher has no double reading and the LCR bottom is more broken up. This indicates a softer bottom.
3) Here we have a hard bottom as (B) and cover as (A) and depth at (C)
4) This example is impossible to read on both units. However, the flasher is the most dependable since the digits on the LCR tend to blink making a depth reading impossible. Also on the flasher will still show a double reading in the case of a hard bottom. This type of reading usually means grass or bait fish in the millions.
On any unit, you want your sensitivity set as high as possible. You can experiment a little and tell when it is set too high because of too much interference. Running both units at the same time may cause interference as well. Plus, you will go cross-eyed trying to see both.
1)

2)

3)

4)
